Portfolio
| Home | In-class Exercies | Assignments | Project | Project: Part I | Project: Part II | Project: Part III |
Final Project: Part - II (The Carbon Footprint: Tracing the Impact of US Energy Production on Climate Change)
Introduction
2023 is set to be the warmest year on record. According to the World Meteorological Organization’s provisional State of the Global Climate report, data up to the end of October 2023 indicates that the year was approximately 1.40 degrees Celsius above the pre-industrial baseline from 1850-1900, with a margin of uncertainty of ±0.12°C. This is significant because it surpasses the record warmth observed in previous years, such as 2016 and 2020.
Furthermore, the first three quarters of 2023 experienced exceptional global heat, making it the warmest year since records began in the mid-1800s and likely for millennia. The last four months of this period, especially September, far exceeded any previous records, with September surpassing the prior record by about 0.5°C.
Additionally, NASA’s Earth Observatory reported that the summer of 2023 was Earth’s hottest since global records began in 1880. The combined temperatures of June, July, and August were 0.41 degrees Fahrenheit (0.23 degrees Celsius) warmer than any previous summer.
Carbon dioxide (CO2) emissions are a pivotal indicator of climate change, primarily due to their substantial contribution to the greenhouse effect. In 2023, global CO2 emissions from energy use and industry are projected to potentially peak, signaling a crucial moment in the context of climate change. The significance of CO2 as an indicator is underlined by the fact that each year, human activities emit more CO2 than natural processes can remove, leading to a consistent increase in atmospheric CO2 levels. This escalation was evident with a new record high in 2022, at 417.06 parts per million. By October 2023, this concentration had further risen to 419 ppm, a stark reminder of the ongoing impact of human activities, which have increased atmospheric CO2 by 50% in less than two centuries. The primary role of CO2 emissions in driving global climate change is well-recognized, underscoring the urgent need for worldwide efforts to reduce emissions to mitigate the worst impacts of climate change.
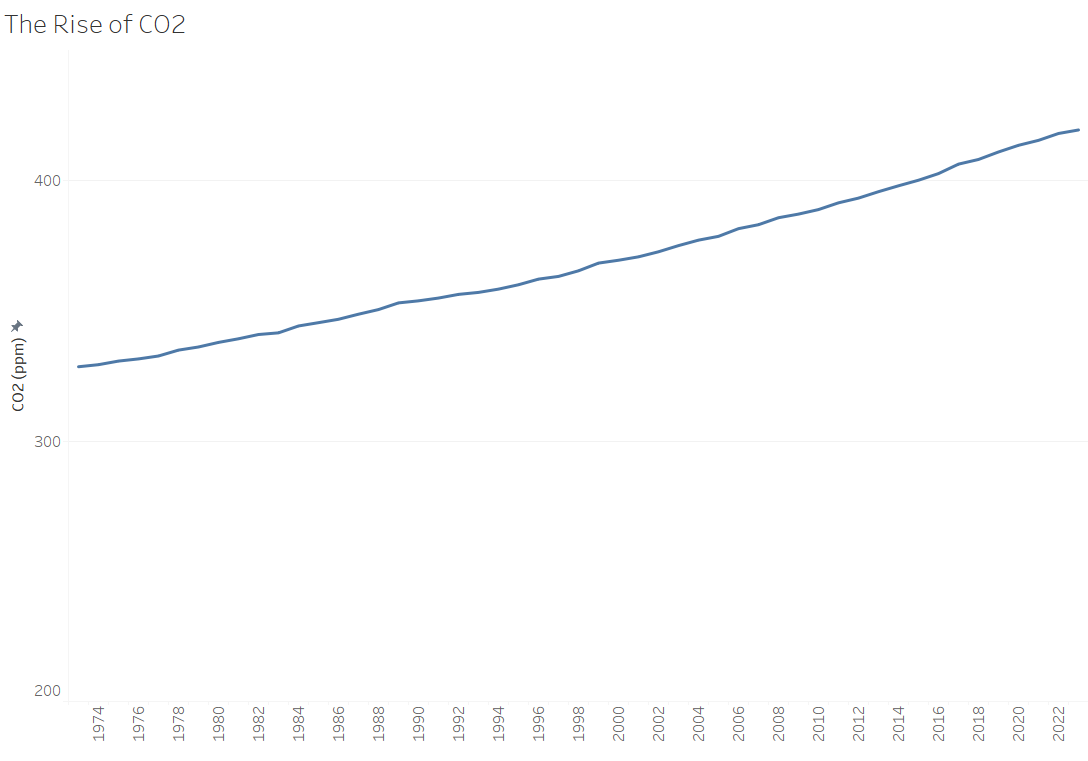
The historical context of CO2 emissions reveals a dramatic and escalating trend. In the mid-19th century, the United Kingdom was the primary emitter, with its emissions being six times higher than those of the United States, which ranked second. By 1850, global CO2 emissions were considerably lower, but with the advent of industrialization, especially in the United States, emissions saw a steady rise. Between 1850 and 1960, emissions grew consistently due to industrialization and population growth. Post-1960, the landscape of CO2 emitters shifted, with China emerging as a major contributor, eventually surpassing the United States as the top emitter after 2005. By 2007, CO2 emissions from developing nations exceeded those of industrialized countries, highlighting a significant shift in the global emissions profile. In 2011, the top 10 emitting countries contributed 78% of global CO2 emissions, a reflection of the concentrated nature of emissions sources.
Change in US energy consumption mix 1973-2023
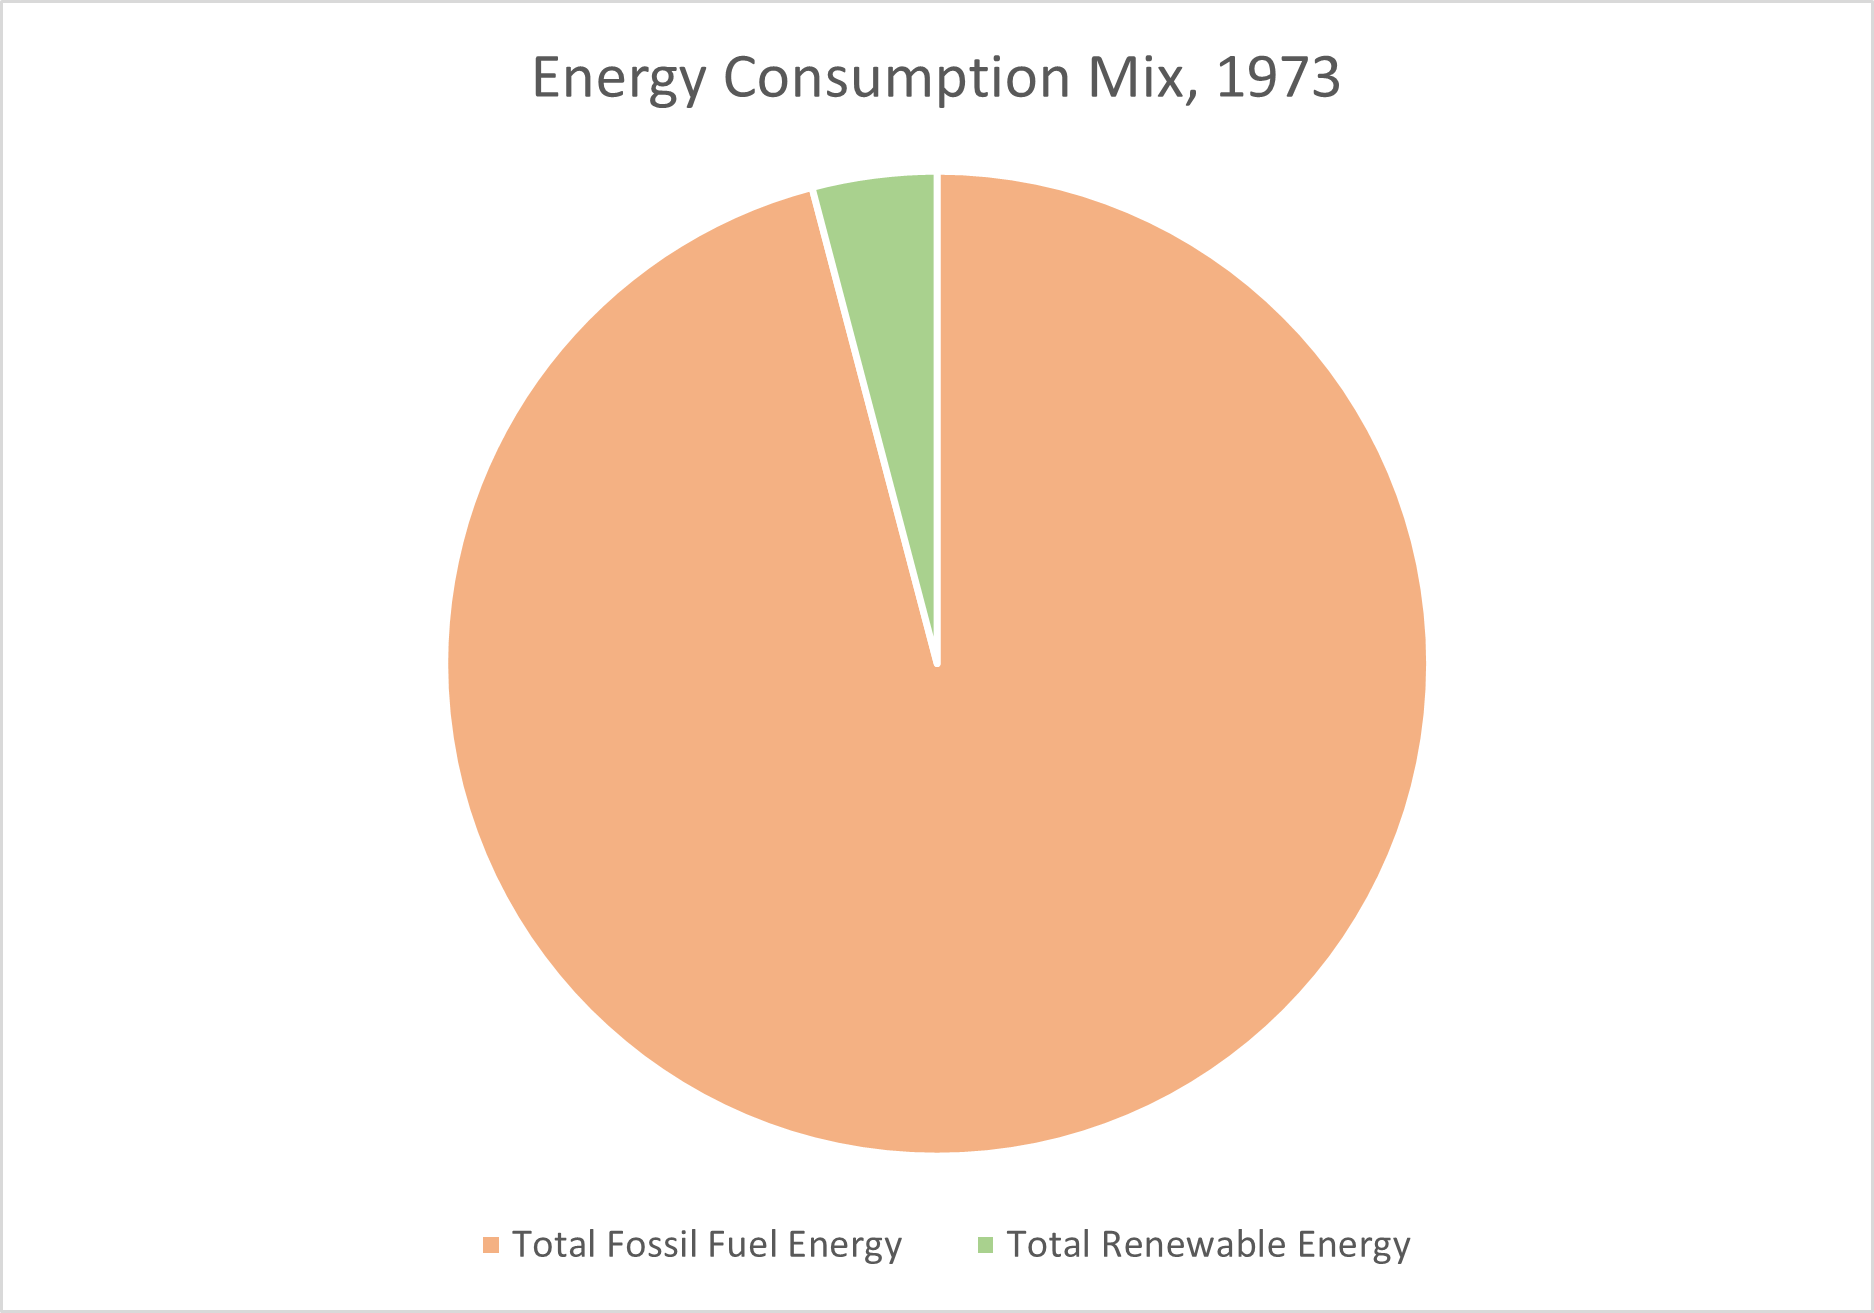
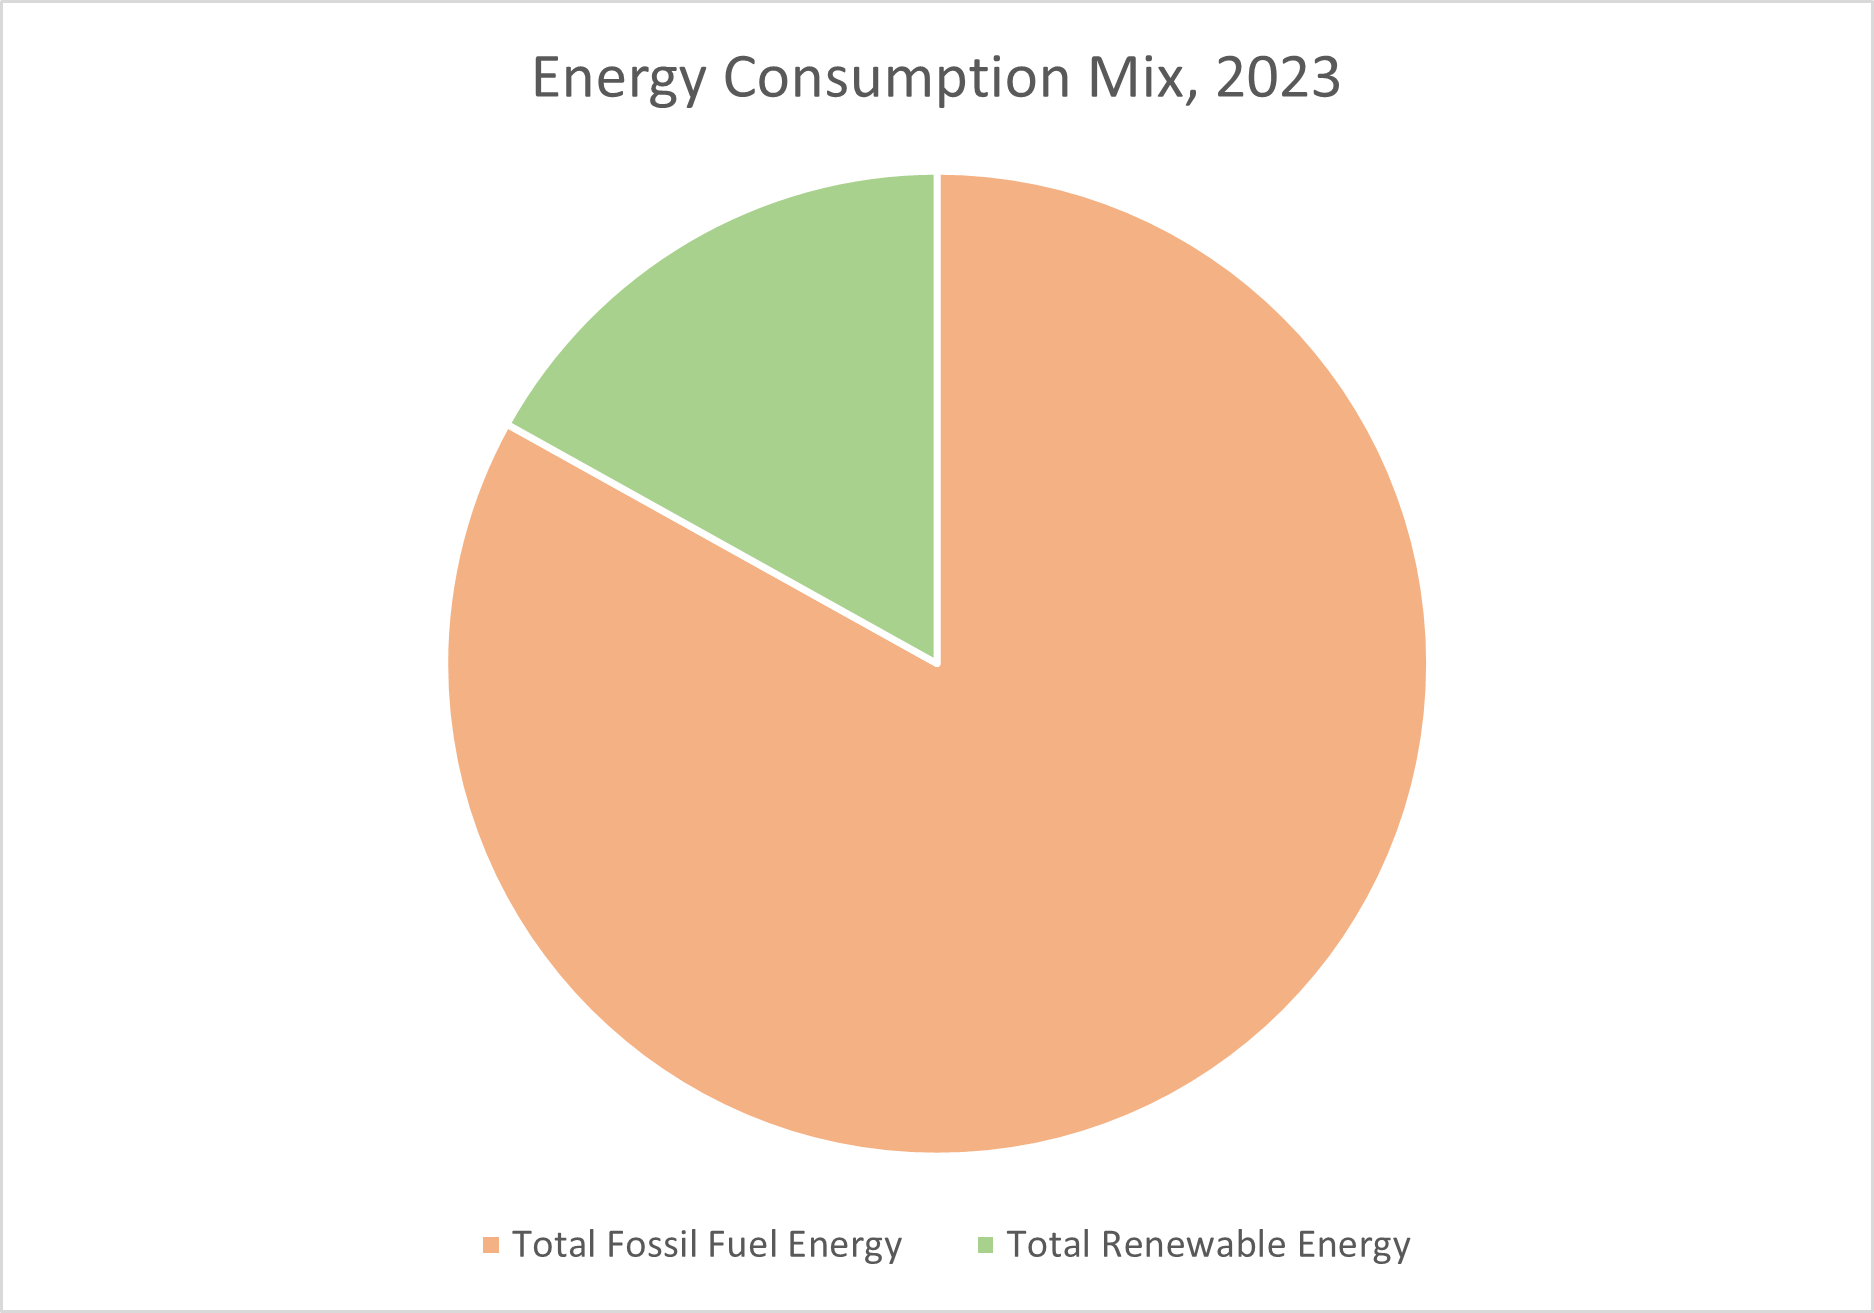
The pie charts depict a shift in the US energy consumption mix from 1973 to 2023, showing a substantial increase in the share of total renewable energy. Despite this shift, CO2 emissions have continued to rise due to several factors.
Firstly, the overall energy demand has grown, so fossil fuel use has not diminished sufficiently to cut emissions even with a larger share of renewables. Secondly, economic and population growth have driven higher energy consumption overall. Additionally, energy-intensive industries and transportation sectors, which are still largely dependent on fossil fuels, have increased their activity. Unprecedented events, like the COVID-19 pandemic and geopolitical tensions, have caused fluctuations in energy use patterns, with temporary drops in emissions due to lockdowns being offset by subsequent increases as activities resumed. Moreover, the transition to renewables, while significant, is not yet at the scale needed to meet the goals of international agreements like the Paris Agreement, which requires a rapid decrease in emissions to limit the rise in global temperature.
The Carbon cost of producing electricity
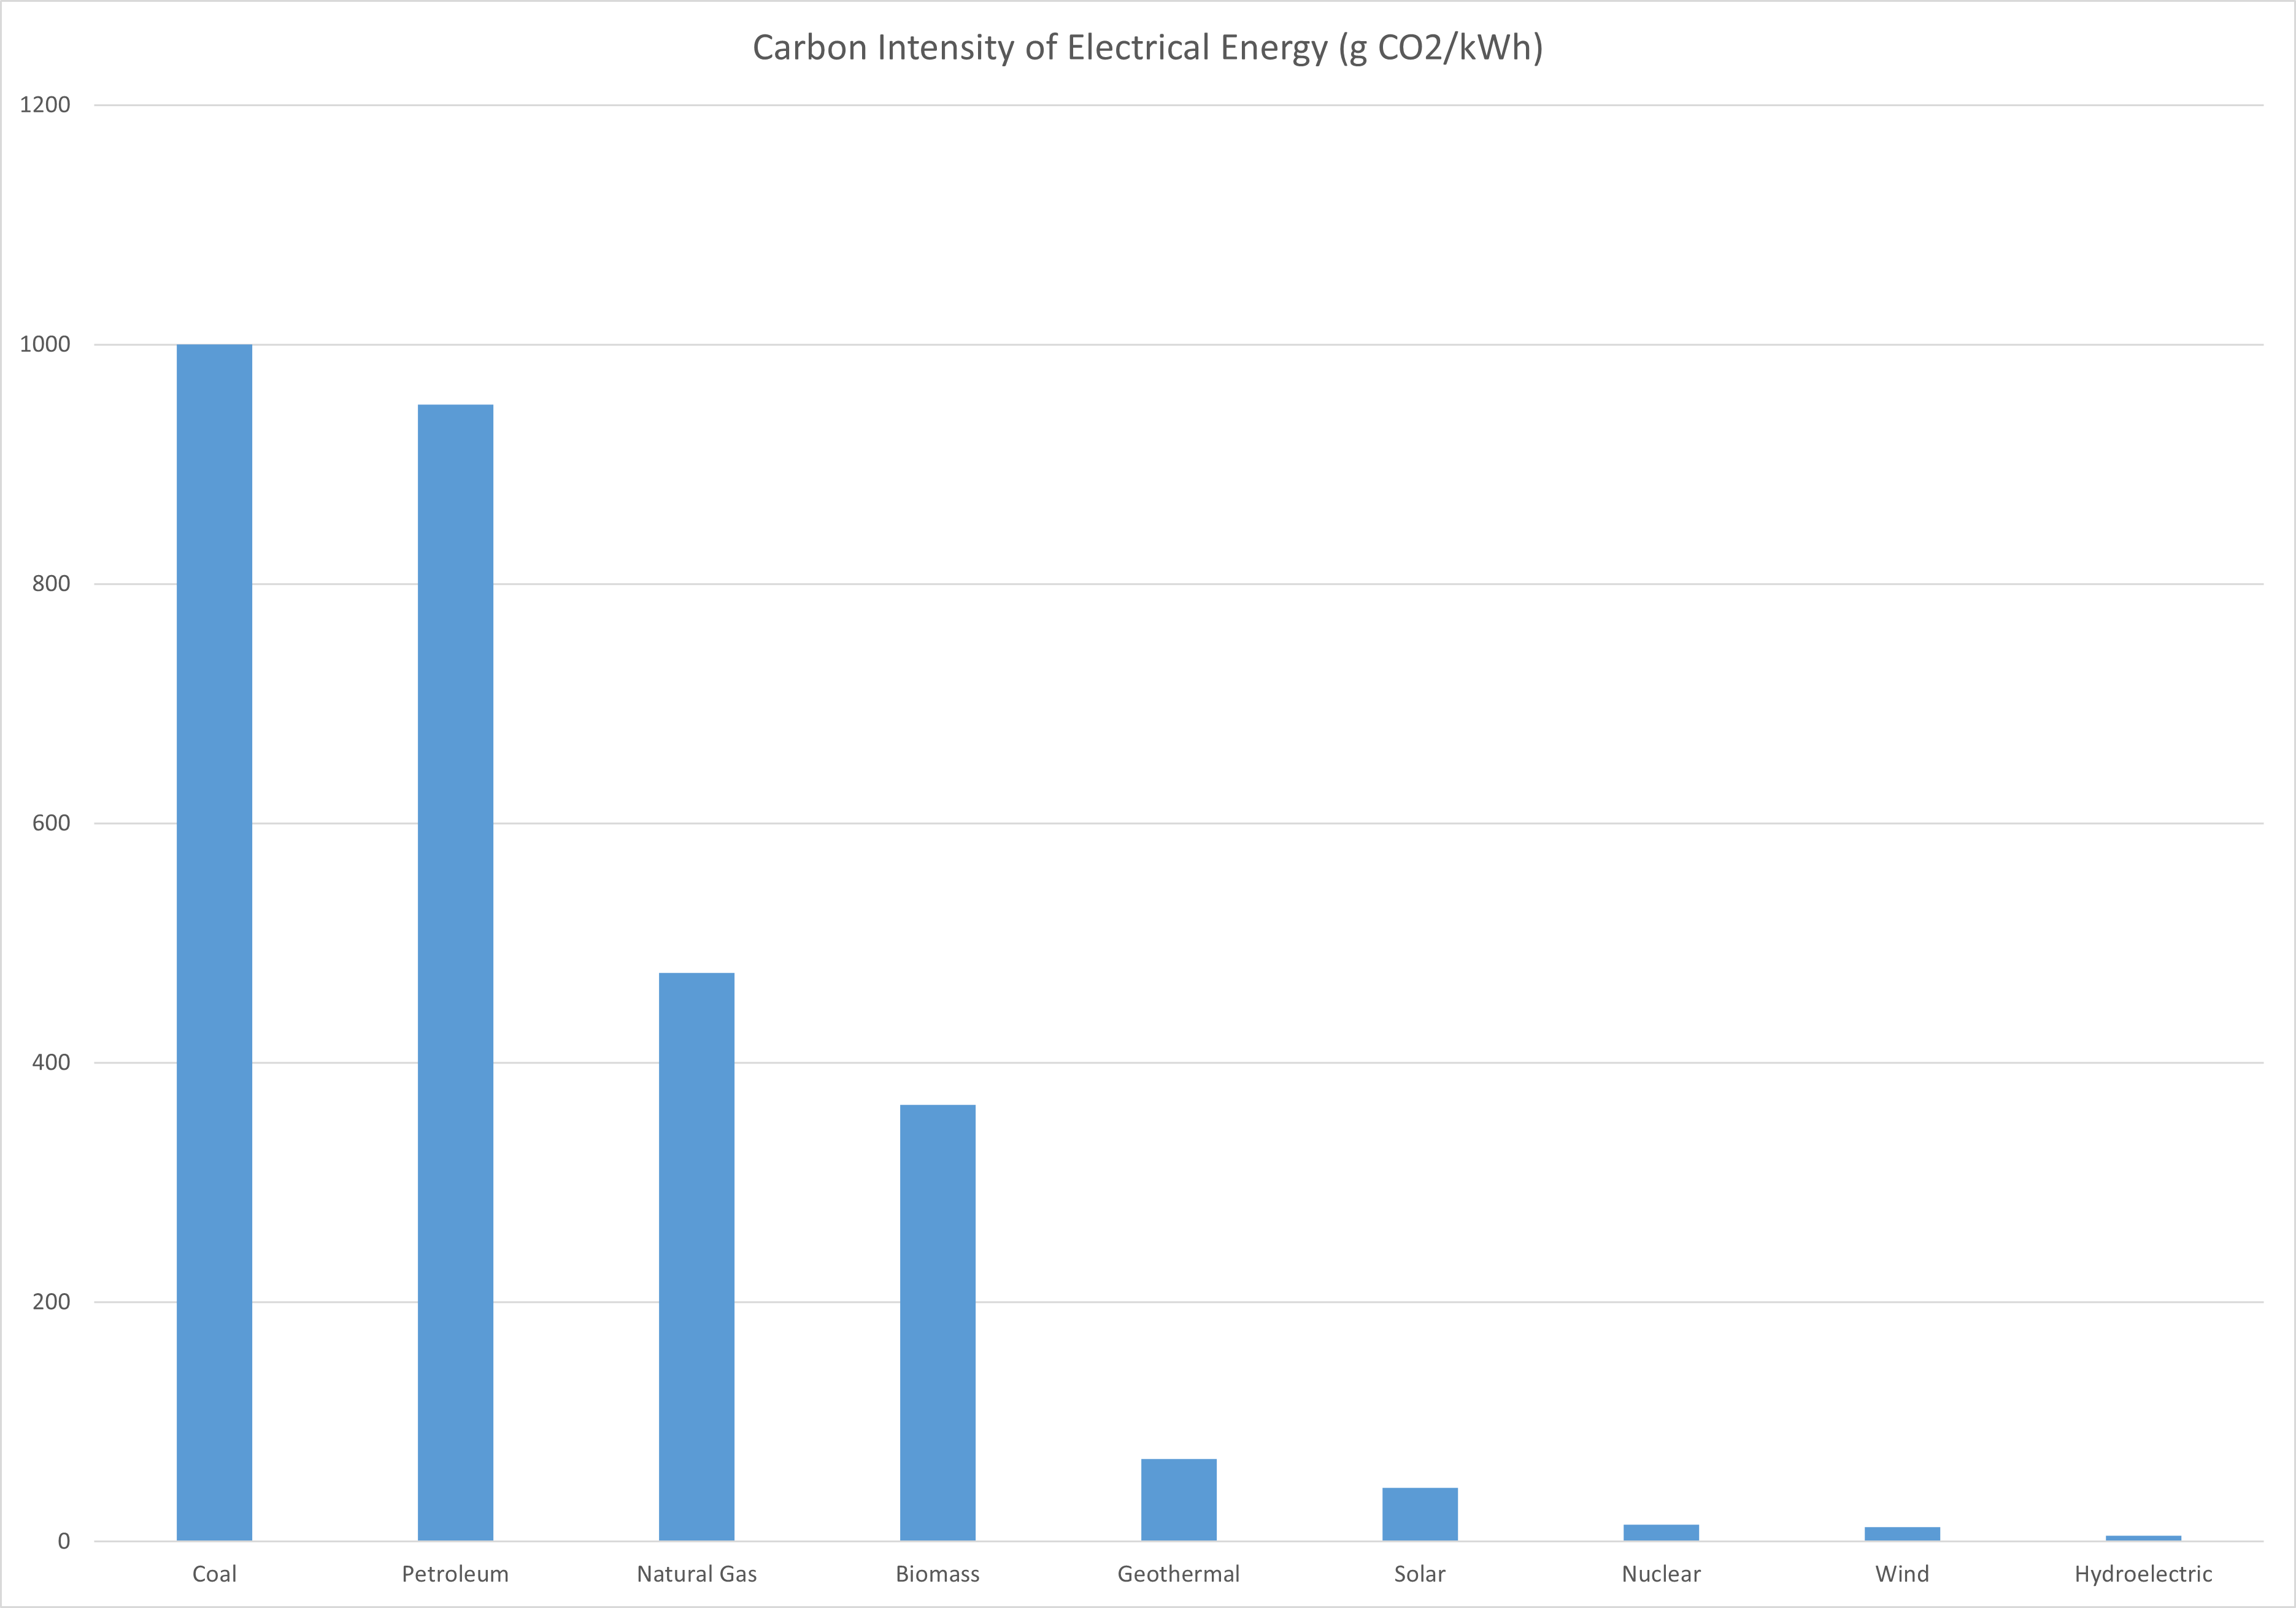
Different energy sources contribute to CO2 emissions to varying degrees due to their carbon intensity, which is the amount of CO2 emitted per unit of electricity generated. Coal and petroleum are the most carbon-intensive fuels, releasing large amounts of CO2 for each kilowatt-hour (kWh) produced. While still a fossil fuel, natural gas emits less CO2 than coal and petroleum but more than renewable sources. Biomass can be carbon-neutral over its lifecycle but still emits CO2 when burned. Renewable sources like wind, solar, and hydroelectric power produce electricity with little to no CO2 emissions, significantly lowering the overall carbon intensity of energy generation. Nuclear energy also has a low carbon intensity, as it does not burn fuel to generate electricity, resulting in minimal CO2 emissions.
Energy production remains the largest source of CO2 emissions globally. According to the International Energy Agency (IEA), global carbon dioxide emissions from energy use and industry could reach their peak as soon as this year, underscoring the significant role of energy production in global CO2 emissions.
The primary driver of these emissions is burning fossil fuels, including coal, oil, and natural gas. These sources accounted for more than 80 percent of the world’s energy in 2009, with sixteen countries relying on fossil fuels for 99 percent or more of their energy needs. The major contributors to global CO2 emissions are electricity and heat production, followed by transportation. This dependence on fossil fuels for energy production highlights the critical need for transitioning to renewable and less carbon-intensive energy sources to mitigate the effects of climate change.
The US’ energy consumption choices
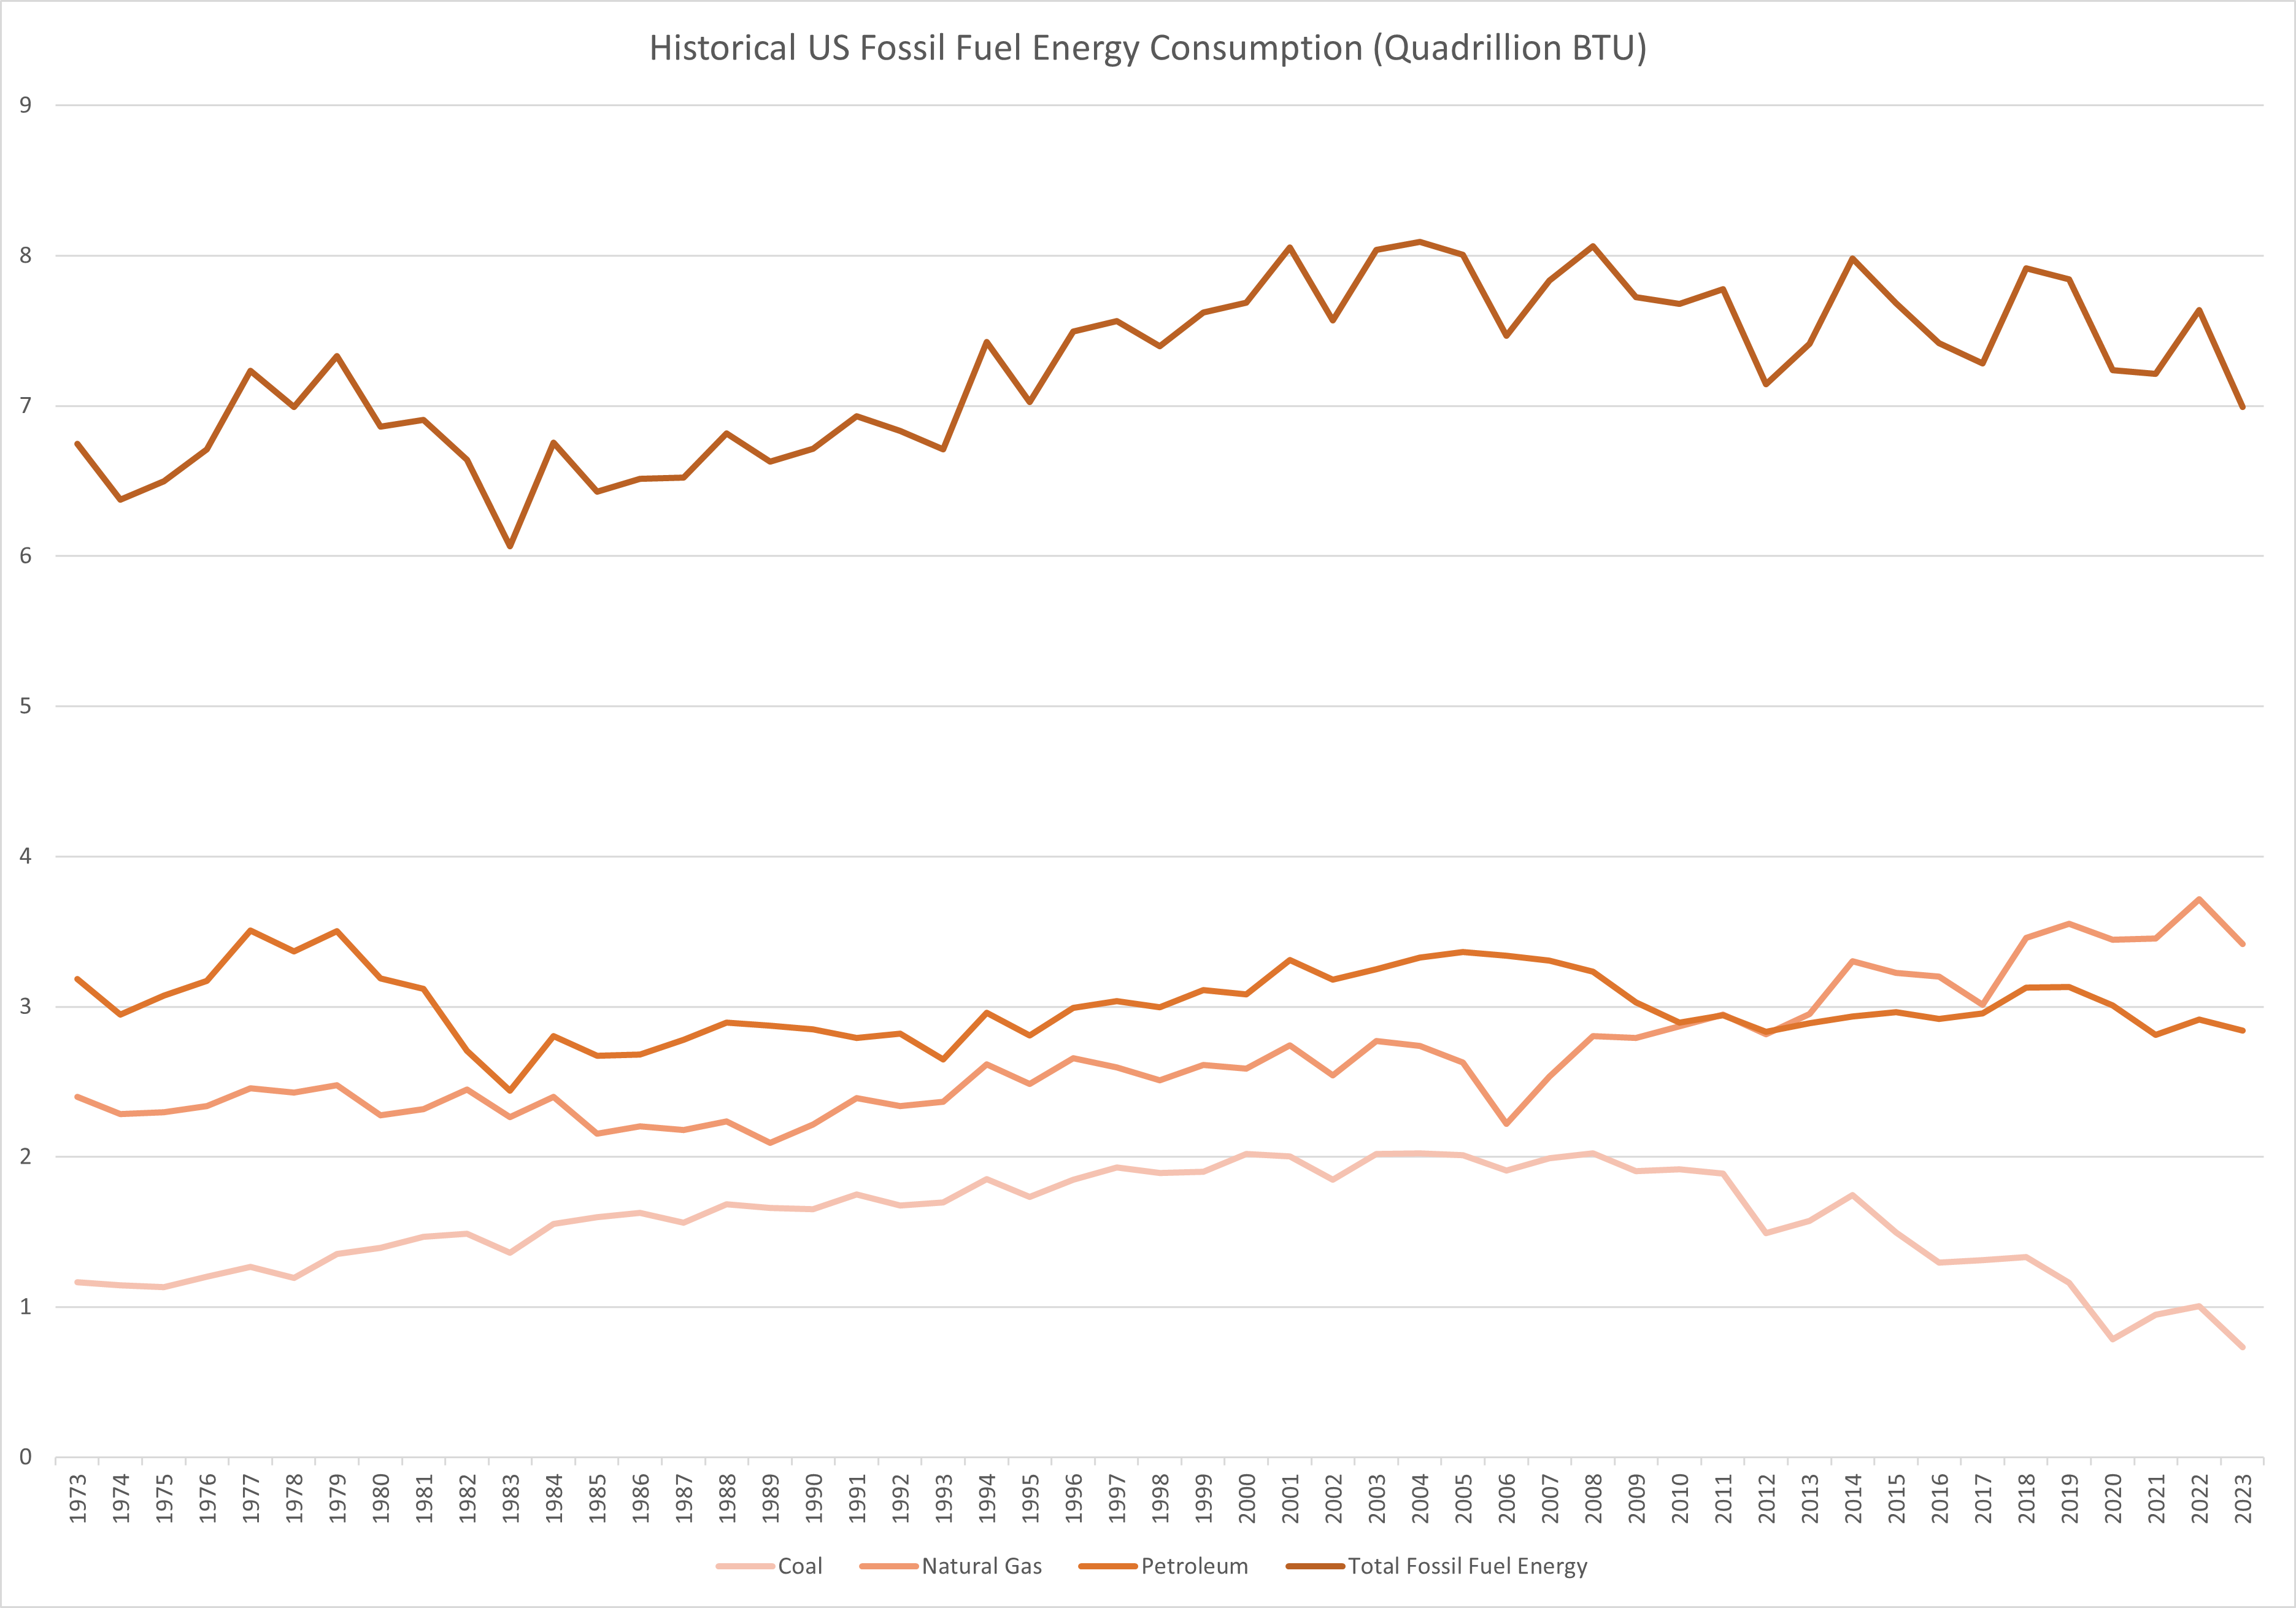
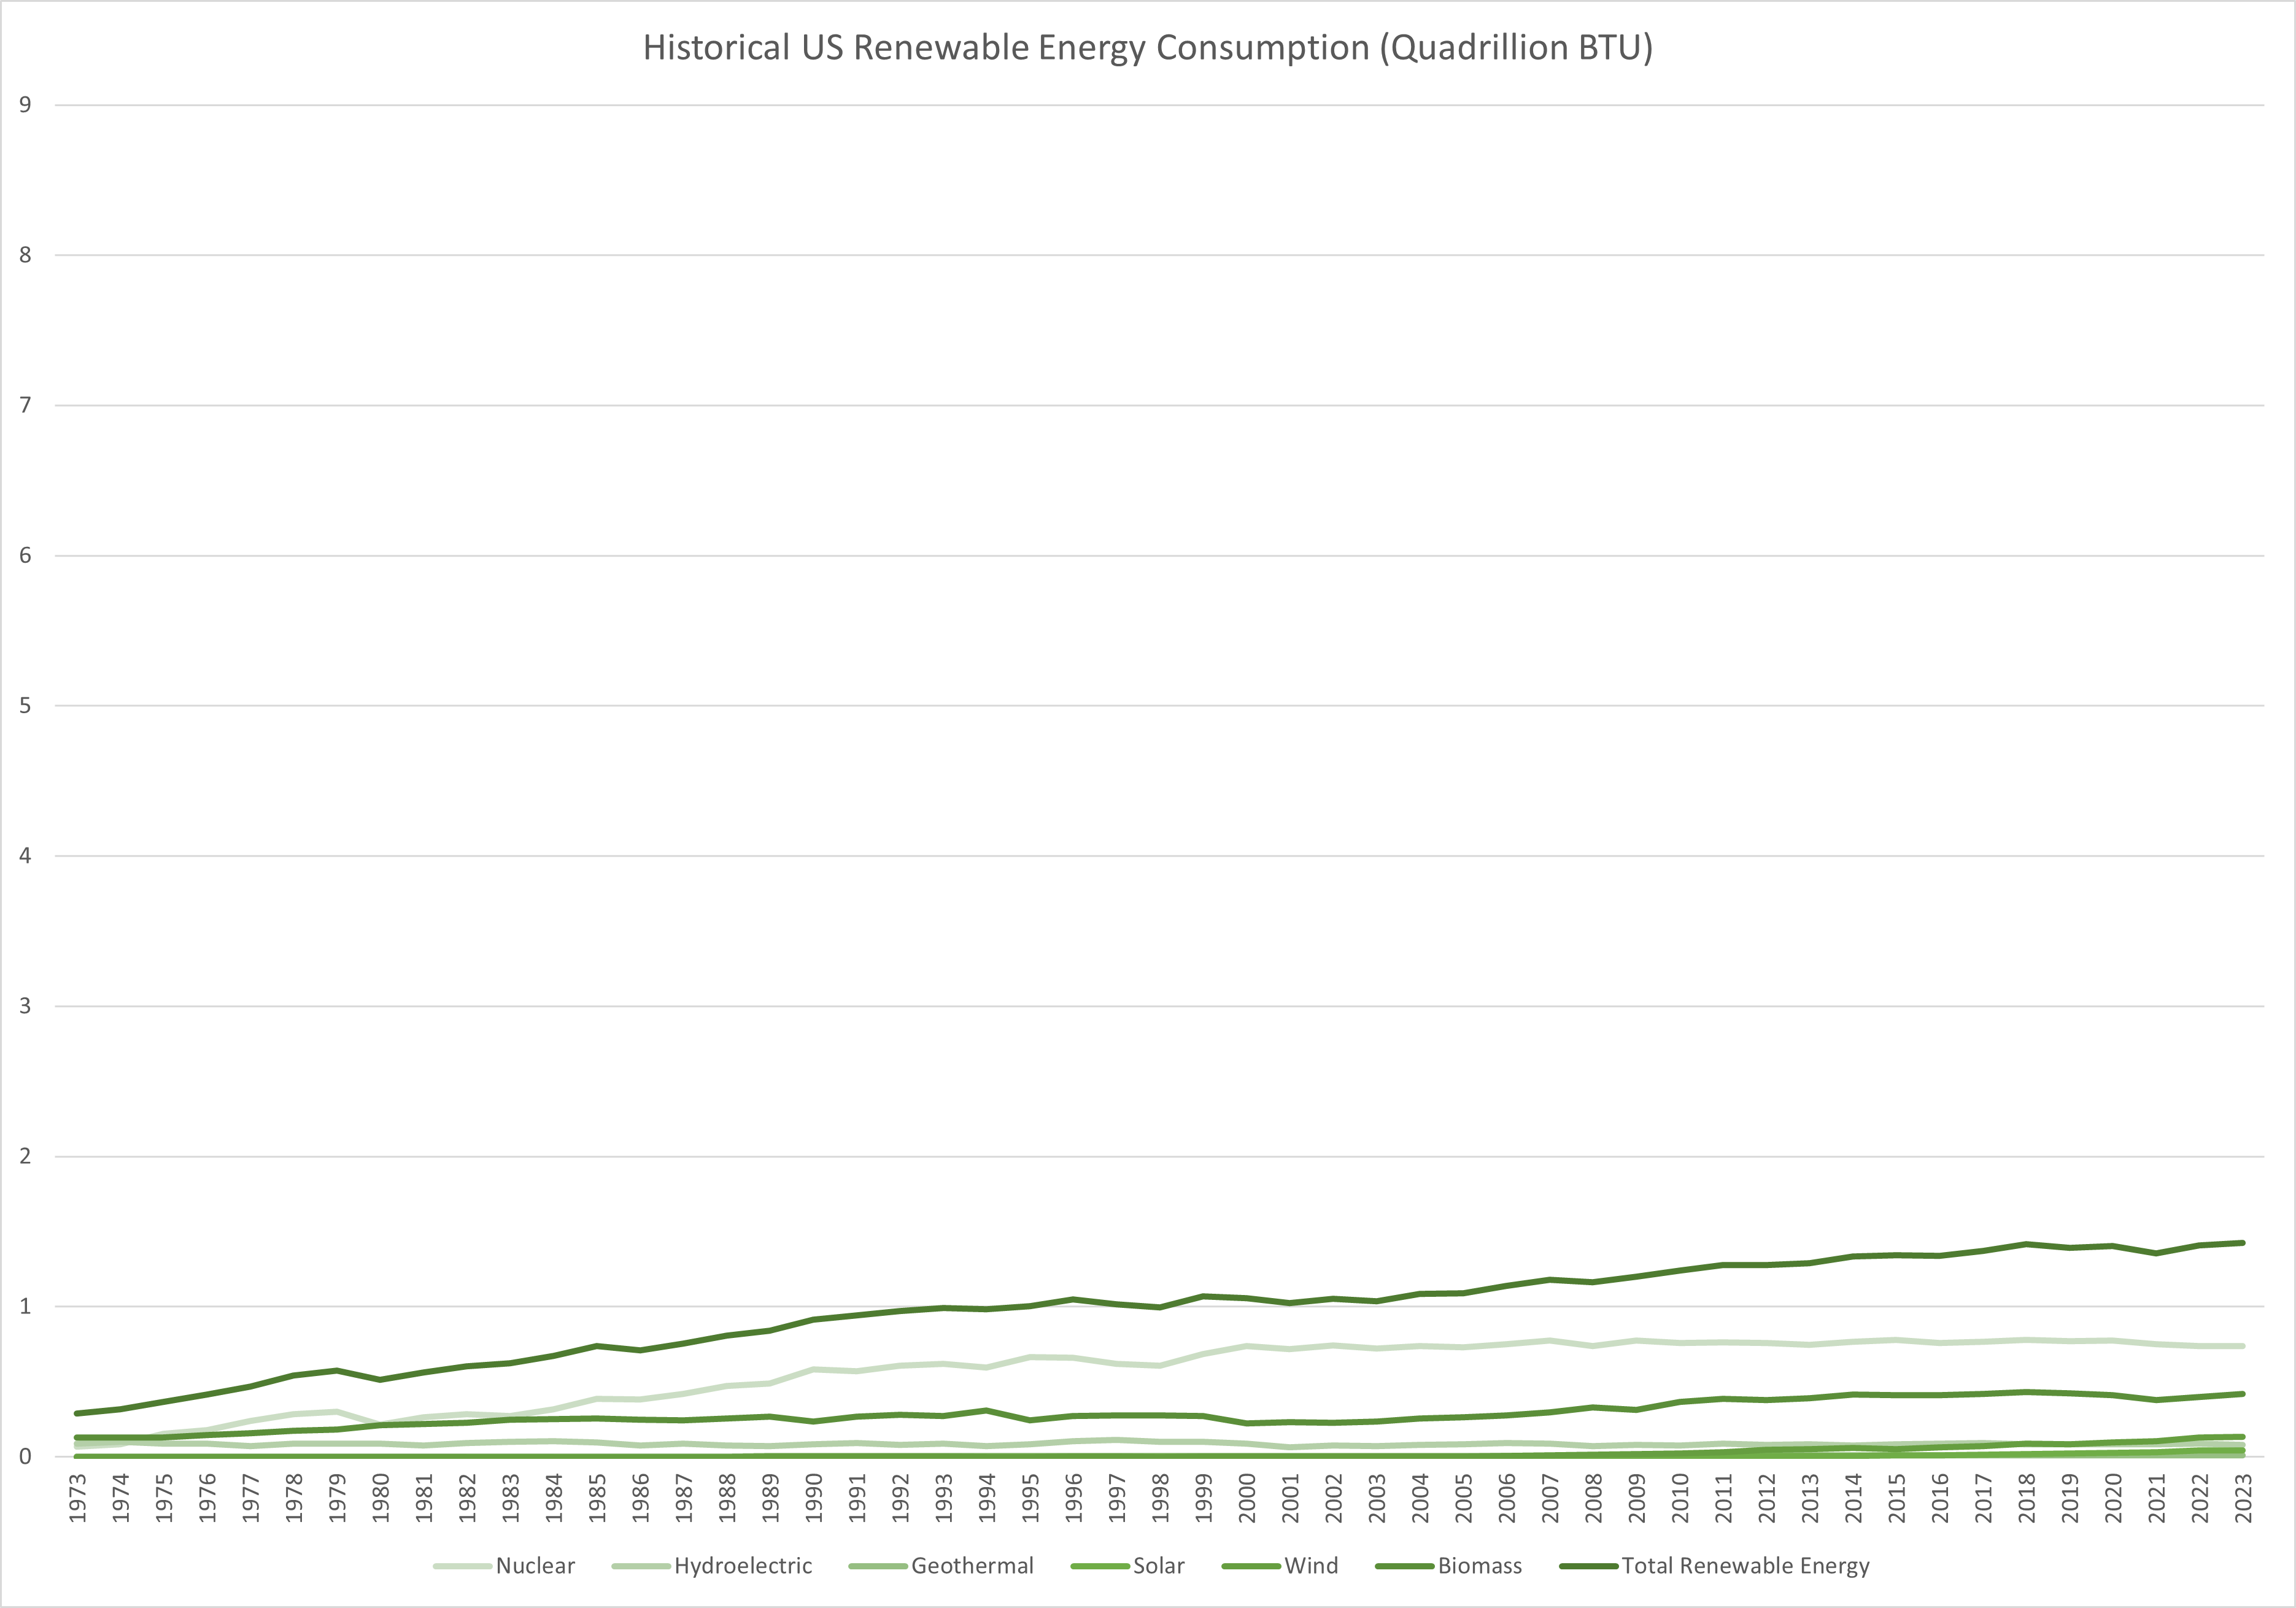
The United States has made strides in diversifying its energy mix, as evidenced by the increasing percentage of renewable energy sources. However, these efforts have not been sufficient to offset the CO2 emissions from energy generation. One reason is the scale of the existing infrastructure and the continued reliance on fossil fuels, which remain a significant part of the energy mix despite the growth of renewables. Moreover, while the efficiency and capacity of renewable energy have improved, the total energy demand has also risen, often outpacing the gains made from renewable sources. This is compounded by the longevity of CO2 in the atmosphere, meaning that even with reductions in emissions, the already present gases continue to impact the climate.
On a global scale, the energy policies and production practices of the United States have far-reaching implications. As one of the largest CO2 emitters, changes in the US energy sector can significantly influence global emission trends. As a leader in the international community, the US also sets an example for other nations. Its commitment to fossil fuels or renewable energy sends a strong signal that can hinder or hasten global efforts to reduce emissions. This influence is direct through its own emissions and indirect through its political and economic influence, affecting international policies and market trends, as seen with its role in the Paris Agreement and other international climate initiatives.
Charting the Future: The next steps in combating global CO2 emissions
The United States’ transition to cleaner energy is imperative for the preservation of the world’s climate. As a significant emitter of greenhouse gases, any substantial change in the US energy policy and practice can profoundly impact the global effort to mitigate climate change. The shift towards cleaner energy is crucial to reduce emissions, slow the pace of global warming, and limit the severe impacts on ecosystems and human societies. This transition is a matter of environmental stewardship and international responsibility, as the effects of climate change are borderless and require collective action from all major nations.
In addition to environmental imperatives, there is a strategic need for the US to transition to cleaner energy to counterbalance China’s growing influence as a leader in clean energy technologies. As China advances in producing and exporting renewable energy technologies, it positions itself as a key player in the global energy market. The US can maintain a competitive stance by accelerating its clean energy transition and ensure its influence in shaping the global energy landscape. This is crucial for economic competitiveness and geopolitical strategy, as energy independence and leadership in clean technology can enhance a country’s global influence and leadership.
User Research Protocol
Target Audience
Primary Audience: Individuals aged 18-35 who are environmentally conscious and interested in learning about climate change and energy production. Secondary Audience: Educators and policymakers who can influence environmental policies and education.
Identifying Representative Individuals
Approach: I will reach out through personal contacts to the people I know who are focused on environmental issues, primarily at CMU.
Interview Script
Introduction: “Hello, my name is Muhammad Ali, and I’m conducting research for a project on climate change and US energy production. I would like to get your insights on a storyboard I’ve created. It will take about 5 minutes, and your feedback will be invaluable.”
Questions:
- “What are your initial thoughts on this storyboard?”
- “Which parts did you find most engaging or informative?”
- “Were there any sections or visualizations that were confusing or unclear?”
- “How does this story impact your understanding or perspective on climate change?”
- “What improvements or additional information could make this story more compelling?”
Closing: “Thank you for your time and valuable feedback. It will greatly help in enhancing the effectiveness of the project.”
Interview findings
1. Response of an Undergraduate Student at Tepper, CMU:
Initial Thoughts: The visualizations are straightforward and present a clear narrative about the relationship between energy production and CO2 emissions. It’s impactful to see the actual numbers.
Most Engaging Parts: The “Carbon Intensity of Electrical Energy” graph is quite compelling. It clearly shows the environmental costs of different energy sources, which I hadn’t fully appreciated before.
Confusing Sections: The “Historical US Fossil Fuel Energy Consumption” graph is a bit harder to interpret due to the overlapping lines. Perhaps differentiating the lines more would help.
Impact on Understanding of Climate Change: These graphs make it clear that energy consumption and CO2 emissions are closely linked. It’s a strong visual argument for the importance of renewable energy.
Improvements/Suggestions: Maybe include some interactive elements or projections into the future based on current trends. It would be interesting to see where we might be headed if things don’t change.
2. Response of a Graduate Student at the Engineering and Public Policy Department, CMU:
Initial Thoughts: The data presentation is precise, and the trends are evident. However, I think there is a missed opportunity to dive deeper into the policy implications of these trends.
Most Engaging Parts: The comparison of the energy consumption mix between 1973 and 2023 effectively showcases the shift towards renewable energy, which is heartening from a policy perspective.
Confusing Sections: The pie charts are too simplistic. In a policy context, it would be beneficial to consider each energy source’s efficiency and reliability.
Impact on Understanding of Climate Change: The story reinforces the significance of energy policy on climate outcomes. It provides a clear visual representation of why policy change is so critical.
Improvements/Suggestions: Incorporate an analysis of policy changes and their impact on these trends. Also, a discussion on the economic trade-offs of the energy transition would be beneficial.
Response of a PhD Student at Heinz, CMU:
Initial Thoughts: The visualizations are good at communicating the basic trends. However, for a more academic audience, the inclusion of uncertainty or confidence intervals would be helpful.
Most Engaging Parts: The “Rise of CO2” graph is striking. The steady increase in CO2 levels over the years is a powerful image that succinctly communicates the gravity of the situation.
Confusing Sections: The “Historical US Renewable Energy Consumption” graph could use some narrative explanation. What do the trends signify? How do they correlate with major renewable initiatives or technological advancements?
Impact on Understanding of Climate Change: The graphs underscore the critical link between our energy choices and the environment. It’s a good starting point for a more nuanced discussion on sustainable energy systems.
Improvements/Suggestions: To enhance the story, consider including predictive models or scenario analysis. Showing the potential impacts of different policy decisions on future CO2 levels could be very persuasive.
Identified changes for Part III
Differentiate Data Presentation:
Improve the readability of overlapping lines in the “Historical US Fossil Fuel Energy Consumption” graph using distinct colors or styles for each energy source.
Add Context to Pie Charts:
Provide more information in the pie charts depicting the energy consumption mix to help explain the significance of the changes over time.
Incorporate Interactive Features:
Introduce interactive elements to the visualizations, allowing users to engage with the data, such as tooltips with more details or sliders to view changes over time.
Introduce Future Scenarios:
Include projections or scenarios that illustrate the potential impacts of current energy trends on future CO2 levels and the effectiveness of different energy policies.
Expand on Economic and Policy Analysis:
Address the economic implications and policy changes related to energy consumption and CO2 emissions, providing a deeper analysis of the transitions between energy sources.